When it comes to measuring your website's success and impact, organic traffic is one of the most important metrics you can analyze.
While most other traffic is earned or solicited, organic traffic is traffic that's au naturel.
People found you via search engines, of their own accord.
While social and paid traffic have their place, organic traffic is your bread and butter in the long run.
Here, you'll learn how to use the world's leading web analytics platform—Google Analytics—to check organic traffic, analyze where it came from, and what it means.

Better yet, I'll show you how to diagnose the reason behind a sudden drop in organic traffic, and show you additional organic traffic tools that can help where Google Analytics falls short.
Phase 1: Checking Your Organic Traffic
If you've already mastered the organic traffic training wheels, you can skip this section.
But if your Google Analytics data isn't filtered (or if you don't know if it is), not so fast! It's important to have a good foundation laid before moving on to the other sections.
We'll go over the basics of how to check you're looking at the right data, why you should set up an IP (or other) filter, and what checking organic traffic means in practice.
A. Match your Google Analytics tracking code
First things first: your Google Analytics tracking code.
There's a lot of resources out there on how to actually set up your tracking code, which we won't be going over here. Rather, I'll provide some context and basic tips to make sure you know what's happening with your tracking code and your site.
Before you get all gung-ho over organic traffic, you want to make sure you're checking the right traffic.
To do this, you need to find and match the tracking code on your site with the tracking code in your Google Analytics account.
Check if there's tracking code
Fun fact:
You can go to any site and check for a Google Analytics tracking code.
Simply go to the website and right-click, selecting "View Page Source." This is a way to get a sneak peek into the back-end code of any website.
If you aren't seeing "View Page Source" at the bottom, that means you're right-clicking on some type of object.
How to tell? It'll show "Copy," "Save," and similar options on the top of your right-click menu, as if you're trying to save an image or something similar.
Try to find some non-object white space (not on an image, a slider, video player, etc.) to get the "View Page Source" to show up at the bottom of your right-click menu. You can also just do "Ctrl + U" to view the page source.
Now, Ctrl + F for "UA-" to find the Google Analytics tracking code.
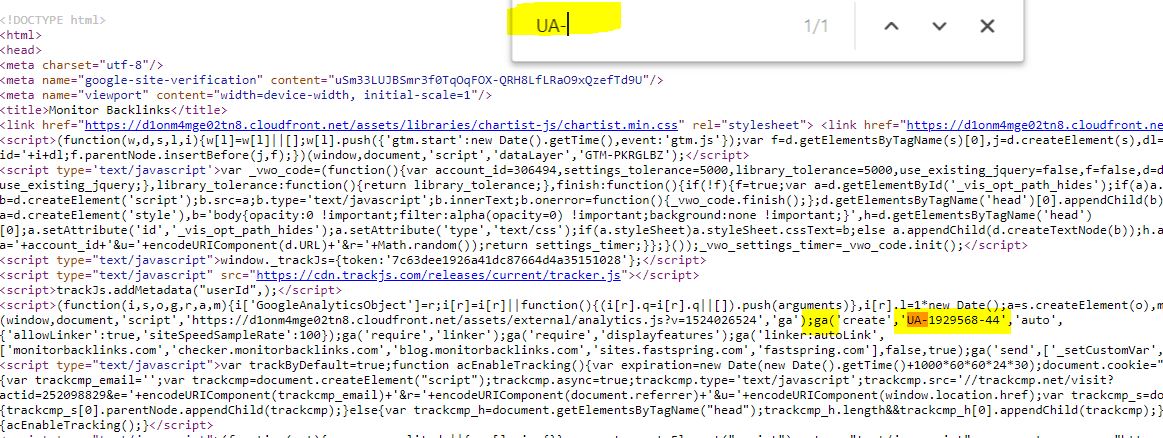
If you find a site with multiple tracking codes, that means Google Analytics has been set up more than once for that site.
It could be that the site has been with a few different marketing agencies, not passing along their analytics (sloppy), or it could be that the webmasters are tracking more than one version of the site (high-tech).
For most of us, it's best to stick with one tracking code to make sure our data collection is accurate.
Find your tracking code in Google Analytics Admin
You want to make sure the code you found in your page source is the same code as the one in your Google Analytics Admin section.
Head to your Admin section (the gear on the bottom left, if you can't find it).
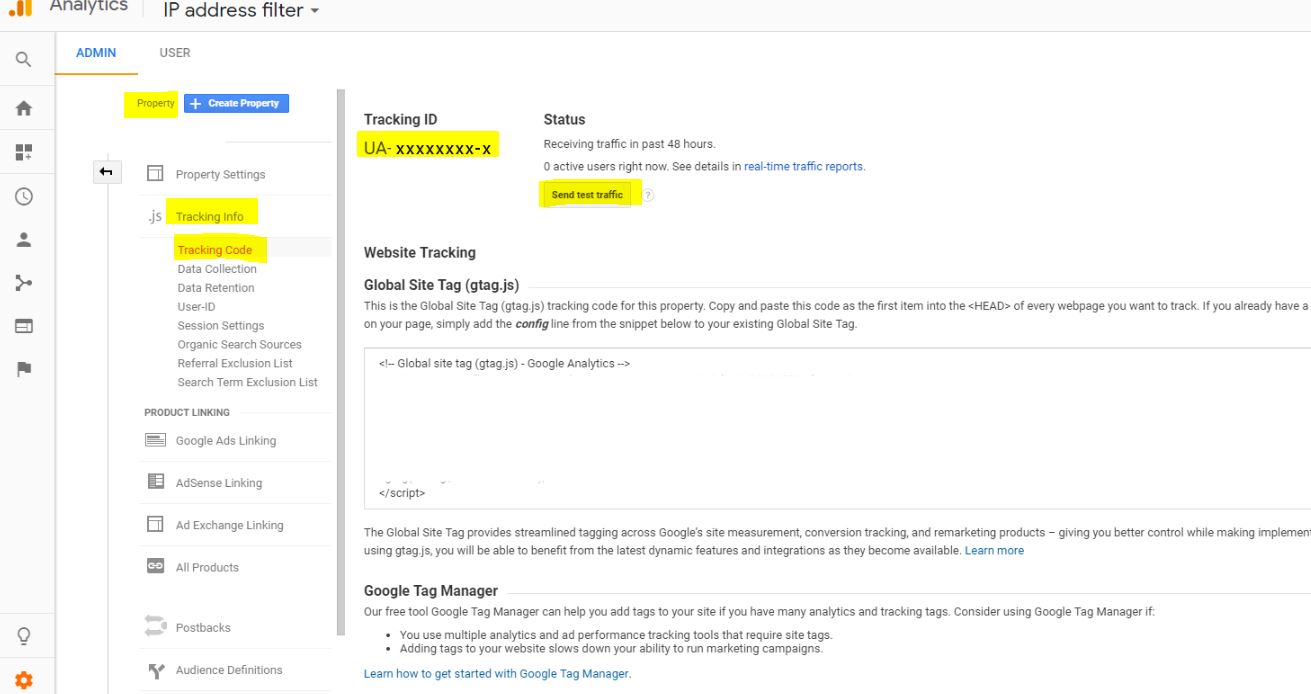
In the middle column under Property, click on "Tracking Info," then "Tracking Code."

Then you'll see your tracking code under "Tracking ID."
You want to make sure your tracking code here matches the one you found in your source code.
You can also check to make sure it's hooked up correctly by clicking on the "real-time traffic reports," which shows the number of active users, meaning people on your site right now, in real time. You should be able to watch the number go up by one if you get on the site, and then go down by one if you click out of the site.
Try "Send test traffic" to check.
B. Leave yourself out of the data with an IP filter
When you're working with data in Google Analytics—especially organic data—you want to make sure you aren't in it.
In other words: You might see a ton of views on the new page you made, or the new blog post you wrote, when in reality all of that traffic is actually just you and other irrelevant people (co-workers, your mom, etc.).
If you don't filter yourself out, you're looking at your own clicks and views, which inflates and distorts your data.
To make sure you're looking at data that actually reflects what you want it to (people who aren't you, your staff, your clients, etc.), you can set up filters. These filters will filter out all that irrelevant data, leaving you with the data you actually want.
While there's a few ways to set up filters, I almost always go with IP filters. With IP filters, you choose IP addresses to filter out of the data.
Simply go to Google and type in "my IP address" and it'll tell you what it is. Filter out IP addresses from anywhere you think is relevant, which will probably include your workplace and your home (for you and others who work on the site) at minimum.
First, create a new "View," one that you'll add the filters to.
It's best to leave your default "All Website Data" view alone (with no filters), just in case you need it later. You can't retroactively retrieve data that was filtered out of a view, so it's best to just create a new view.
Name it something like "IP address filter." Then create a filter for every IP address you want to filter out, like so:
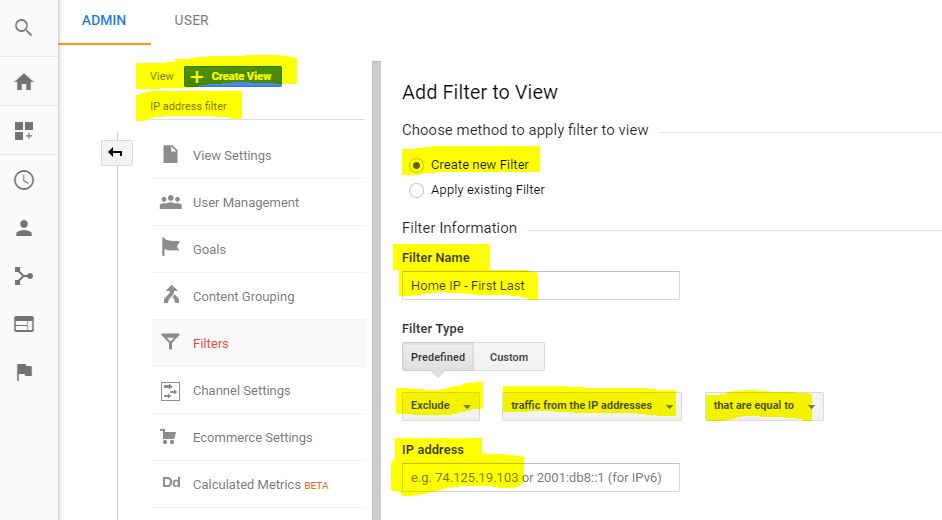
Name each filter for where the IP address is from and whose it is (i.e. "Home IP - Grey," "Work IP - Brady"), so you don't get confused about what exactly you filtered out later.
Once that's all set up, just make sure you're looking at that View when you're checking out your analytics.
C. The basics of checking your organic traffic
Now that you can rest assured the data in your Google Analytics is 1. the correct data, and 2. not inflated with your own time on the site, it's time to check your organic traffic.
On the left sidebar, click "Audience," and then "Overview."
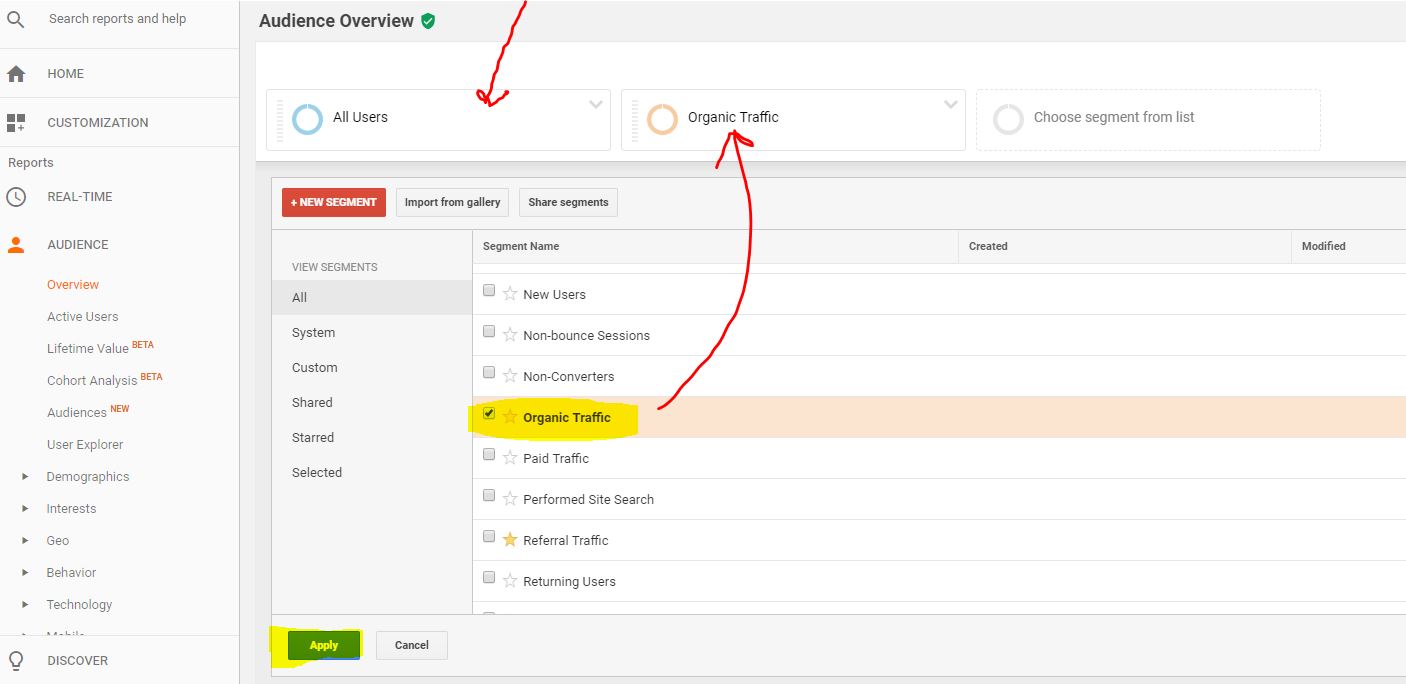
To see organic traffic, click on the grey box that says "All Users," which will lead you to the screen below. Scroll to find "Organic Traffic" in the segment list, select it, and press the Apply button.
Set up like this, you'll see All Users data in blue and Organic Traffic in orange.
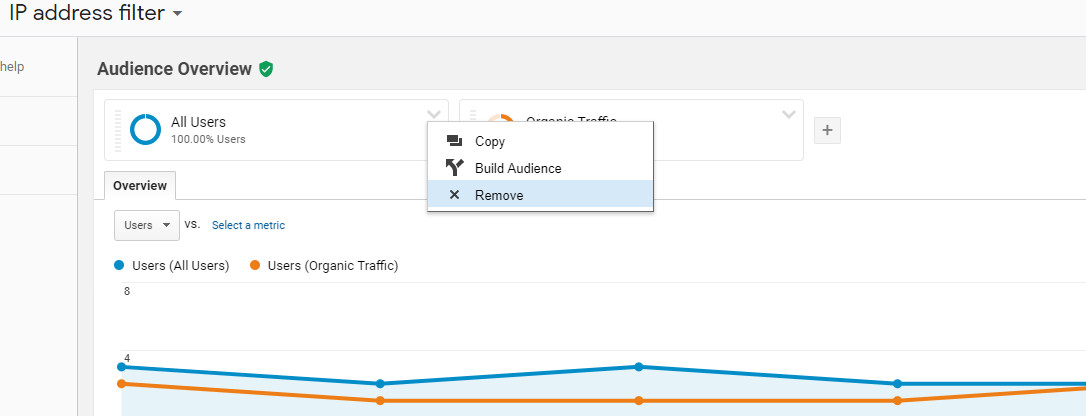
If you'd rather just see organic traffic, you can get rid of the All Users segment like so:
However, it can be helpful to see All Users alongside Organic Traffic.
For instance, the average session duration is a lot longer for organic traffic than it is for all traffic. The bounce rate is also significantly lower for organic traffic.
These two factors combined can be interpreted to mean that the quality of organic traffic is higher than the average for all traffic, while the quantity of organic traffic is about a third of total user traffic.
The line graph shows users, not sessions. You can think of it as the number of people who visited your site, rather than the number of times your site was visited.
In the line graph below, you can see some spikes in the All Users data, which you can tell aren't from organic traffic. In this particular case, these spikes are mainly the result of email campaigns from this one-woman-wonder B2B website.
The display defaults to showing you the past week, but you can change the date range to whatever you want in the upper right.
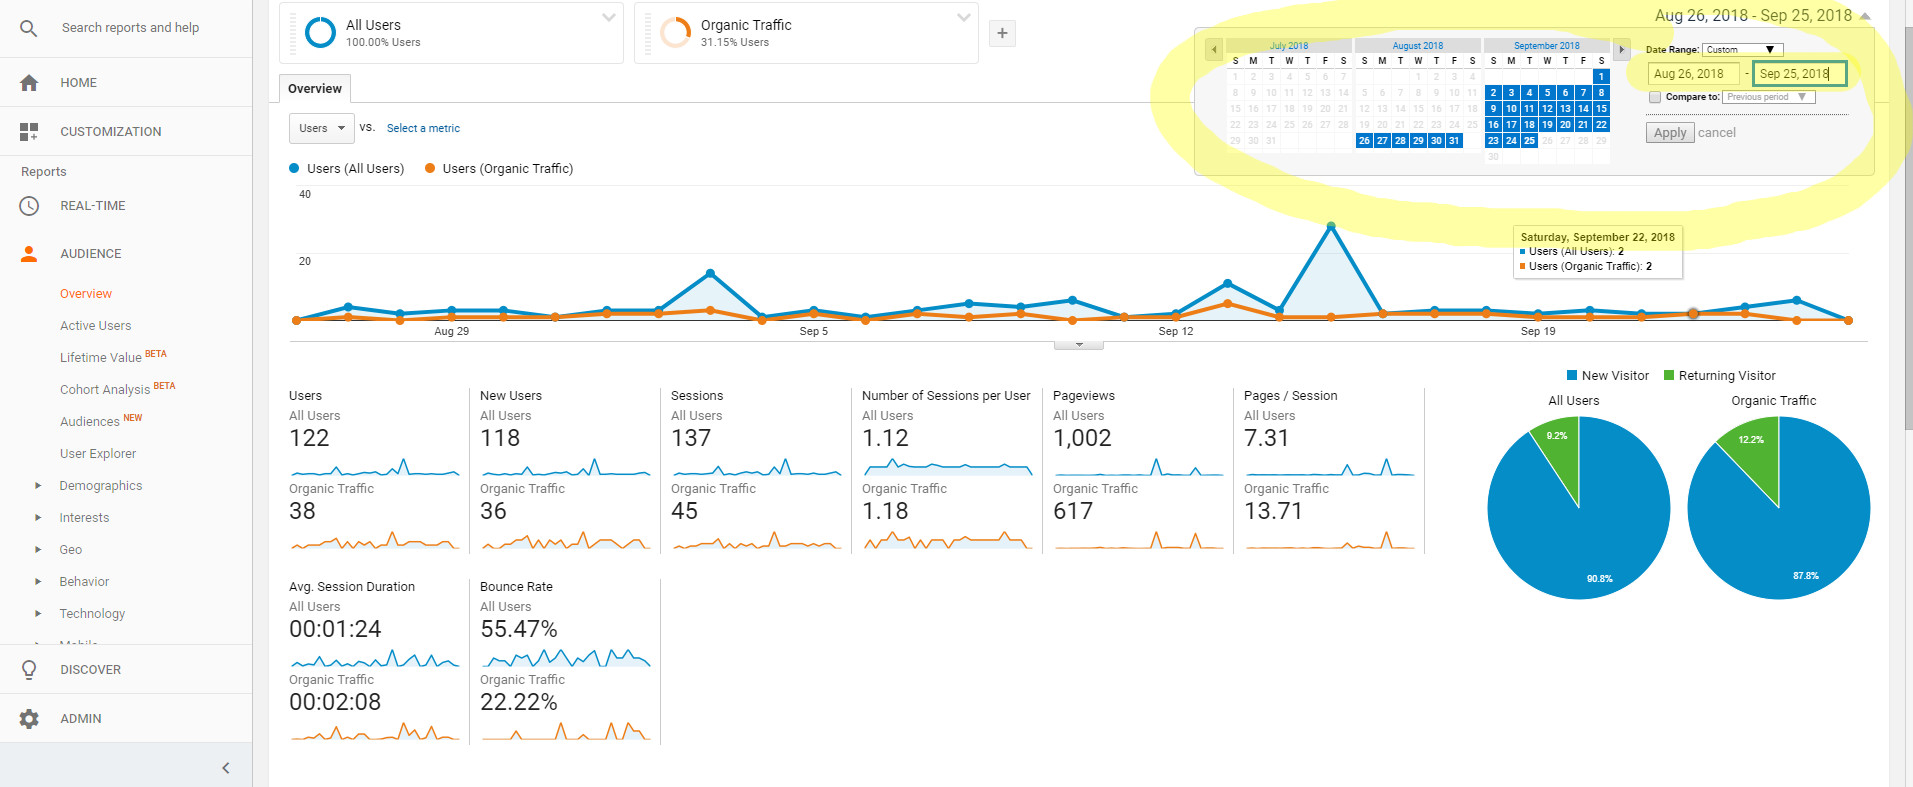
Here's a quick overview in plain language of what the numbers below the line graph mean, for the chosen date range:
- Users - All unique users. That means if you visit a website twice, you still count as one user.
- New Users - People who visited your site for the first time in the date range.
In the above example, you can see most users are new for this date range. The blue and green circle graphs on the right give you a visualization of new vs. returning users.
- Sessions - The number of times your site was visited. If one user visits a website three times, each of the three visits will be added to this number.
- Number of Sessions per User - The average number of sessions per user. Basically, it just divides sessions by users for you.
- Pageviews - The number of pages viewed on your site by users. Each page viewed counts, even if one user visits the same page twice in one session.
For instance, if you go to a site's homepage, then navigate to another page, then back to the homepage a second time, this will count as three pageviews.
- Pages / Session - The average number of pageviews per session.
- Avg. Session Duration - The average time each user spent on your site per session.
- Bounce Rate - The most misunderstood metric of all. When someone "bounces" from your site, that means they came to your site and left, entering and exiting your site from the same page, with no other site interactions. You can think of it as all sessions where the user only visited one page in their session, then left.
In Google's own words, the bounce rate is "the percentage of all sessions on your site in which users viewed only a single page and triggered only a single request to the Analytics server."
The higher your bounce rate is, the more one-hit users you had. While many marketers view a high bounce rate as bad, this is not necessarily the case, especially when you're looking at data for individual pages.
Phase 2: Learning Where Your Organic Traffic Comes From
Time to shed the training wheels and dig deeper into your organic traffic and where it's actually coming from.
For the most part, you can learn how you "acquired" users via various metrics through the "Acquisition" tab on the left.
A. What platforms did organic users use to find you?
Go to "Acquisition," "All Traffic," and finally to "Source/Medium."
The data below can look a little funky (and isn't very helpful) when you have the "All Users" and "Organic Traffic" segments selected for this area of Google Analytics.
Exit out of the "All Users" to get a clean look at where your organic users came from (don't worry—you can bring that segment back in just a few clicks whenever you want).
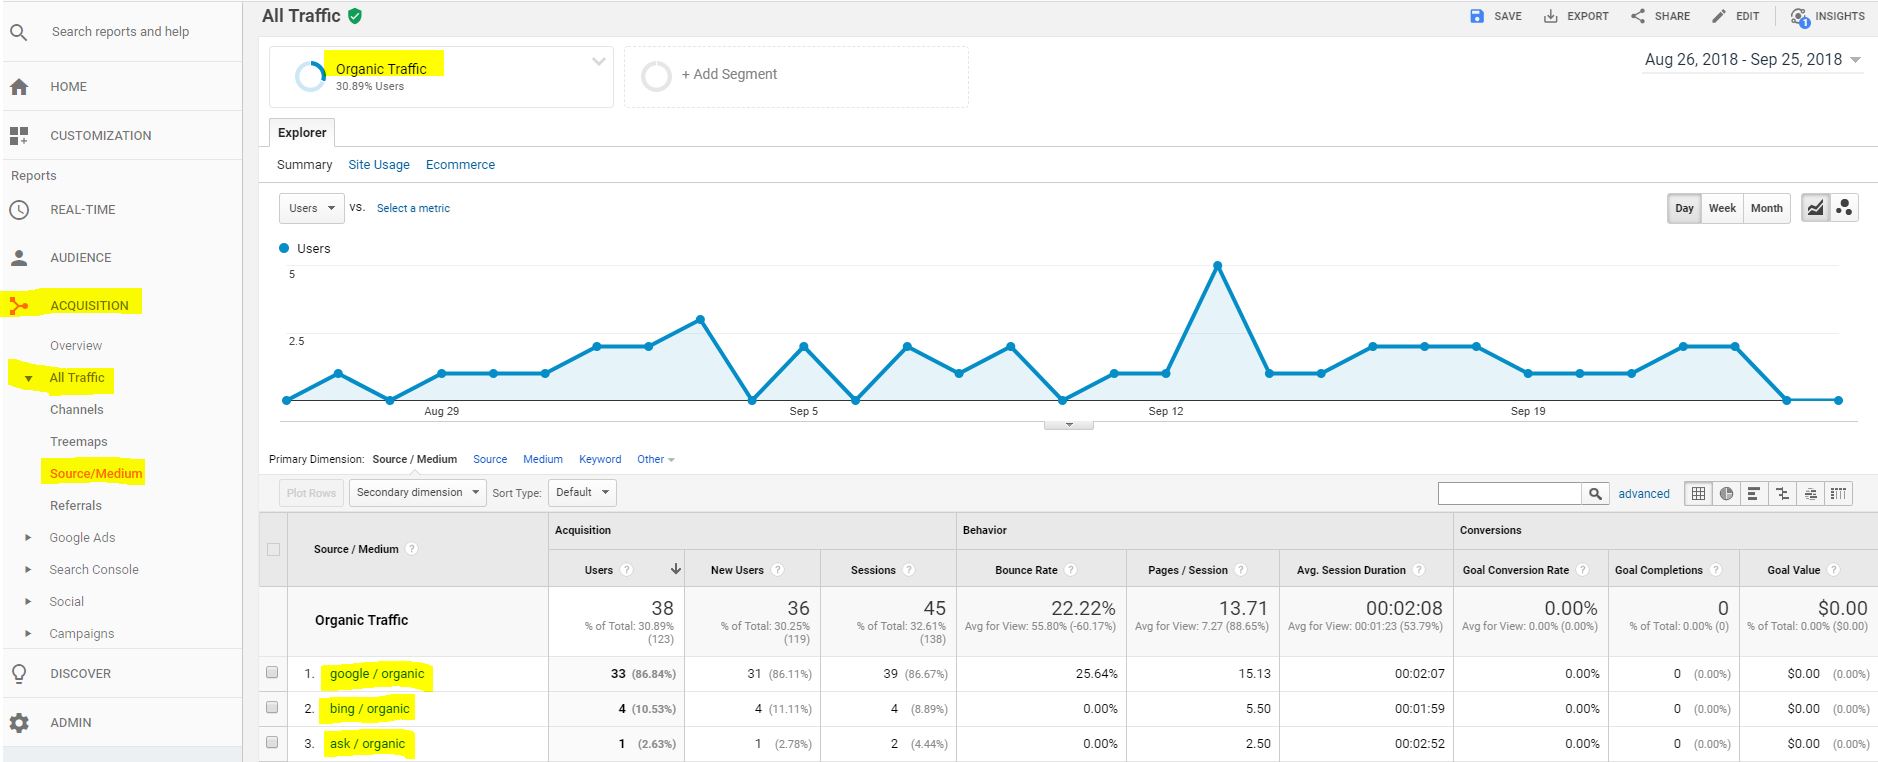
Since we're working with organic traffic, you can expect to see Google, Bing and other search engines.
If people got to your site through social media, that's considered "social traffic" rather than organic. Likewise, if someone got to your site from another site (that means you have a backlink, lucky you!), that's called "referral traffic," which is also separate from organic traffic.
There's also "direct traffic" (when someone types in your domain directly) and "paid traffic" (self-explanatory).
If you're hoping to get a look into traffic from anywhere other than search engines, then you'll want to focus on a different type of traffic.
B. What devices did organic users use to find you?
Mobile is changing a lot in the world of SEO and organic traffic.
As more users are on their phones and tablets, Google has pushed webmasters to make their sites more mobile-friendly. This started with rewarding sites that were mobile-friendly, meaning they were responsive and fast.
More recently, Google has been transitioning to indexing and ranking sites by their mobile version (i.e. "mobile-first indexing") rather than their desktop version.
With mobile-first indexing, you'll want to make sure the mobile version of your site is up to speed for ranking purposes. Still, if you're a B2B company, it's likely that most people visiting your site will do so from their desks at work rather than on their phones.
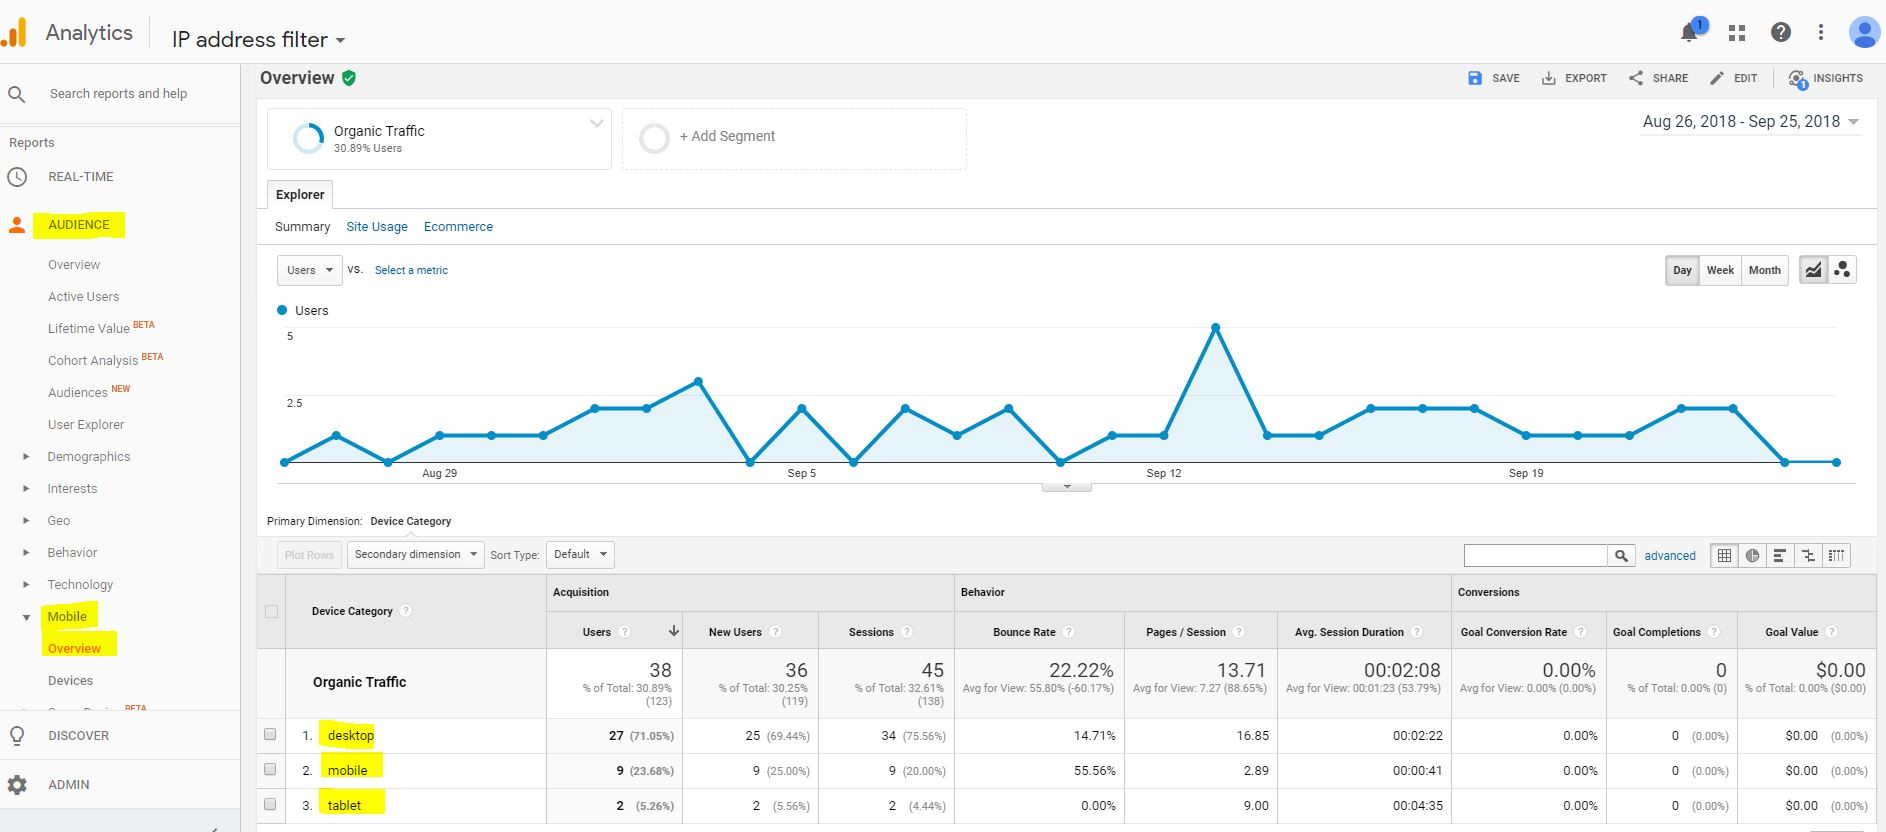
Don't take my word for it though—best to check your own traffic to see how many people are on mobile vs. desktop in reality.
To find what devices organic users were on when they navigated to your site, go back to "Audience," then "Mobile," and finally, "Overview." You can select "Devices" if you want to know if your users skew Android or Apple.
C. Where are your users located geographically?
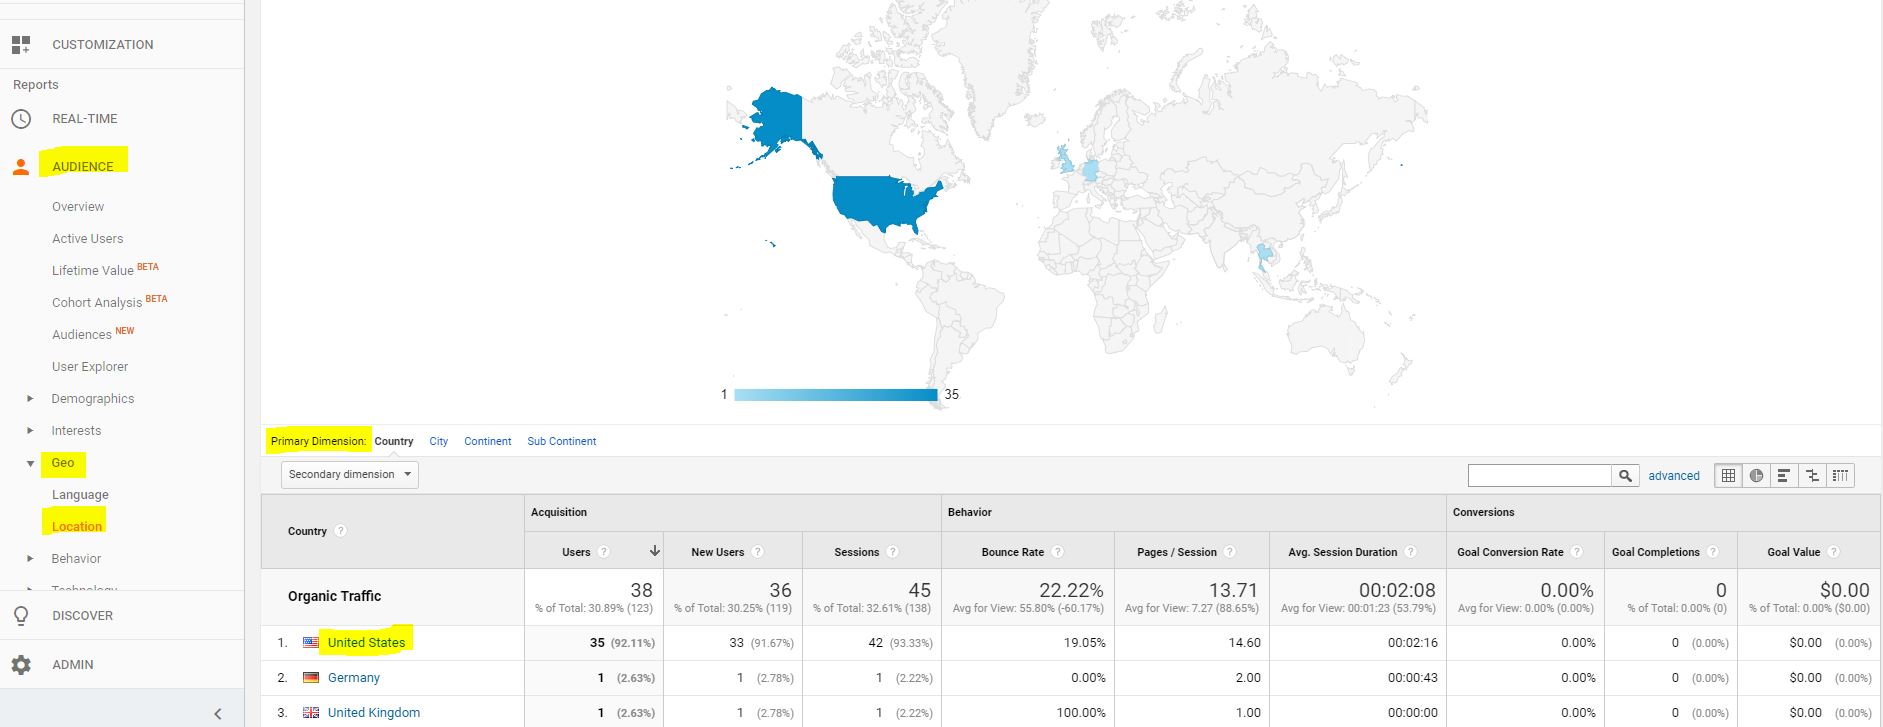
Finding out where your users are from can help you see if your site is reaching relevant people. For instance, if you're a local business, then traffic from far away is pretty irrelevant.
To find where your users are, go to "Audience," then "Geo," and "Location." You'll see the global default, which shows you how much organic traffic you have from which countries.
To see traffic on a more granular scale, you have two options:
1. Change "Primary Dimension:" You can change your primary dimension from countries to cities. This will include traffic from all cities globally.
2. Choose a country: If you just want to focus on your own country (say, the US), you can click directly on the US, which will only show you traffic from the US.
From there, you can click through to a specific US state to see city traffic from just that state, or you can change your Primary Dimension from "Region" to "City" to see traffic from all US cities (in all states). Play around with this to make sure you get the difference.
D. What about organic keywords and rankings?
It's true—you can go to "Acquisition," then "Campaigns" and "Organic Keywords" to see some of your organic keywords—supposedly.
But if you've kept up on SEO tools in the past few years, you'll know that free Google tools that help with keywords have become increasingly unreliable (and frankly, useless).
For instance, a 2015 experiment by Moz showed the discrepancies between what the free Google Keyword Planner shows you and reality. On the same note (and more recently), Google AdWords' keyword volume numbers have proven to be unreliable.
Don't let yourself be fooled into thinking Google is giving away free, valuable info on anything related to its organic ranking algorithm. If you want insight into your keywords and rankings, you're probably going to have to pay for it through one of the many wonderful, powerful SEO tools out there.
As great as Google Analytics is, it doesn't cover everything, especially when it comes to heavy hitters like keyword and backlink info.
Phase 3: Understanding Your Organic Users
Now that you know how to find organic traffic and how they found you, it's time to ditch the bicycle for a scooter and delve into user behavior.
A. How are organic users navigating through your site?
My favorite part of Google Analytics! Head to "Behavior," then "Behavior Flow" to see how users move through your site.
This shows all the different pathways users have taken through your site, from most common to least common.
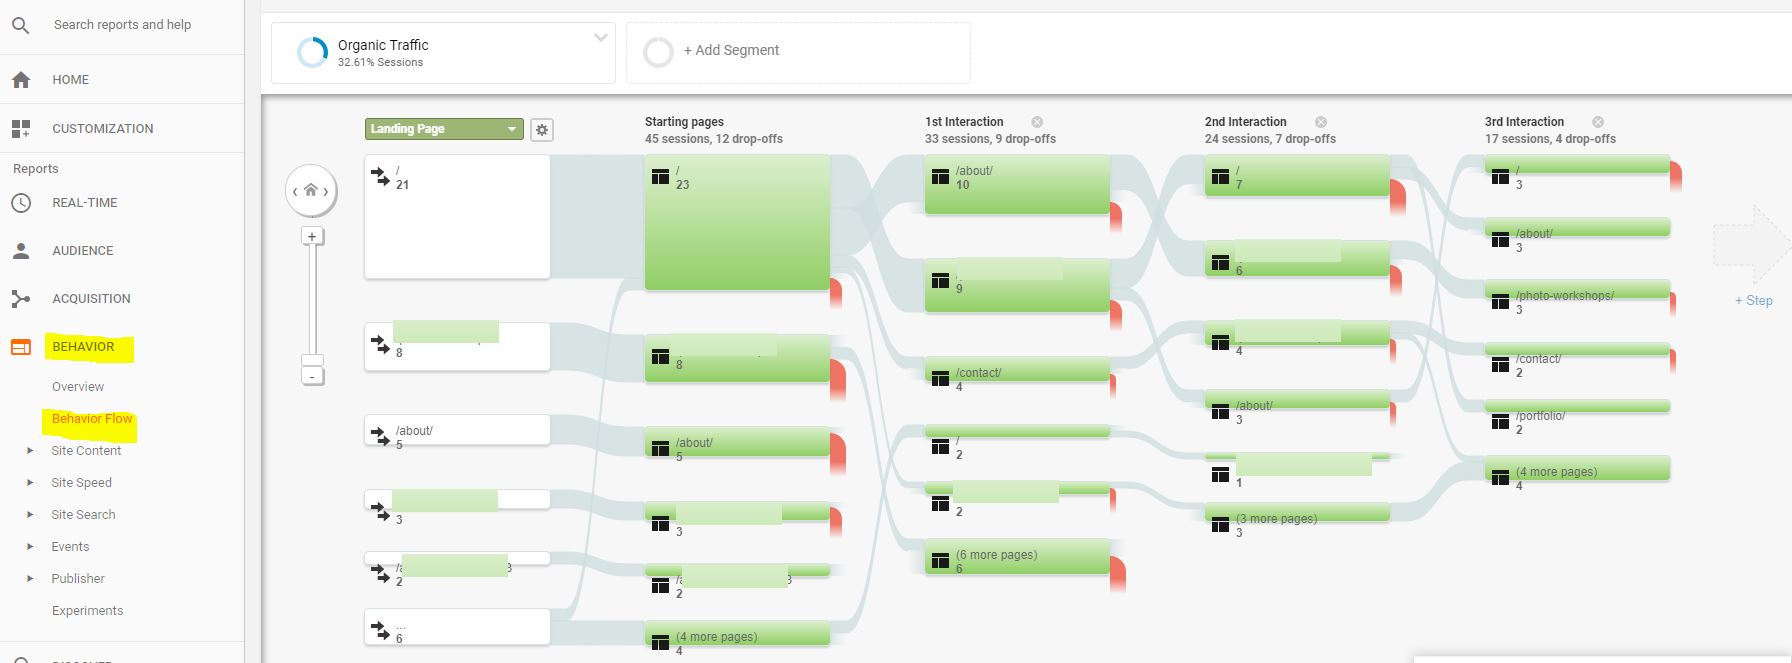
The real value here is seeing if users are navigating your site as intended.
You can figure out where and why people are "dropping off" (the red), and use that info to optimize your user funnel.
B. How are organic users behaving on specific pages?
Go to "Behavior" and then "Site Content" to look at "All Pages," "Landing Pages" and "Exit Pages."
All Pages will give you a look at all pages visited on your site, anywhere in the user's flow. Landing Pages will only look at pages people entered on, and Exit Pages focuses exclusively on the pages people exited your site through.
Pro tip:
If you're working with limited resources but want to optimize your site for mobile, you can check which pages are specifically visited more via mobile than desktop.
For instance, if you're a brick-and-mortar store, it's possible that Location pages will have a higher proportion of mobile visits than other pages on your site. You can prioritize making those pages the most mobile-friendly.
In the screenshot below, I got the column "Device Category" here by selecting the "Secondary Dimension" option "Device Category."
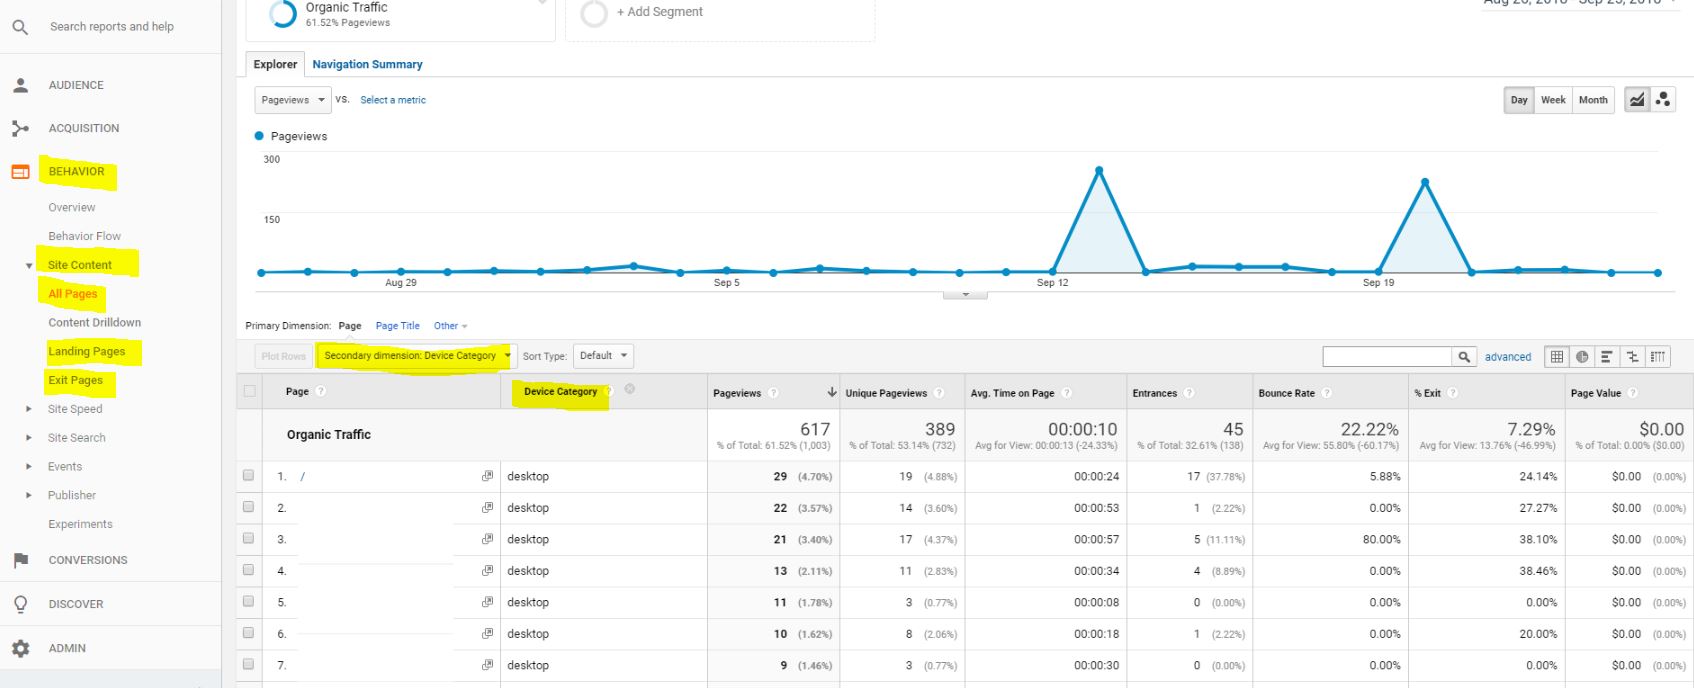
Now, the data will split, showing one row for x-page that was users on desktop, and another row for the same x-page that was users on mobile.
There's a lot you can do with secondary dimensions. See what the options are, play around with them, and think about what the data is now showing with a new secondary dimension selected.
Phase 4: Diagnosing a Sudden Drop-off in Organic Traffic
Motorcycle time: diagnosing a sudden drop in organic traffic.
When you're doing this, make sure you keep an open mind, look everywhere, and play with date ranges to look for changes.
For instance, I once found a new client's drop in traffic was actually a good thing.
How? They were a local store in a city with a common name (think: Springfield). It turned out all of their lost traffic was irrelevant traffic to them anyway, because it was lost traffic from other Springfields far away. That kind of traffic wasn't helpful to my client's business, and it wasn't helpful to users in other cities named Springfield.
In this case, you could say Google was correcting itself.
Here's some places to look when figuring out why there's been a drop in organic traffic, which includes some of the things you learned above:
- Check Google Search Console for errors, algorithm updates and/or penalties
- In Google Analytics, check if you had a drop in mostly mobile users, and learn more about mobile-first indexing
- In Google Analytics, check if there was a drop in traffic from a specific source/medium
- In Google Analytics, check the geographic location of your traffic before and after the drop
- Use a backlink checkerto check link loss and for bad links you'll want to disavow
- Use SEOptimer to check your competitors and see if they might have "stolen" your organic traffic via rankings
How to Get More Control Over Google Analytics Organic Traffic Data
Buckle up buttercup. For the ultimate control over your organic traffic data in Google Analytics, look no farther than the Google Analytics add-on tool.
It allows you to easily import your Google Analytics data into Google Sheets, where you can make your own charts and calculations. You don't need to know how to code or do anything fancy with scripts, but having a good grasp of spreadsheet capabilities and formulas is recommended before attempting to use this at home.
If you're a data-freak like me who prefers to set things up in spreadsheets rather than trying to find workarounds with the Google Analytics dashboards that just don't get it quite right, this is for you.
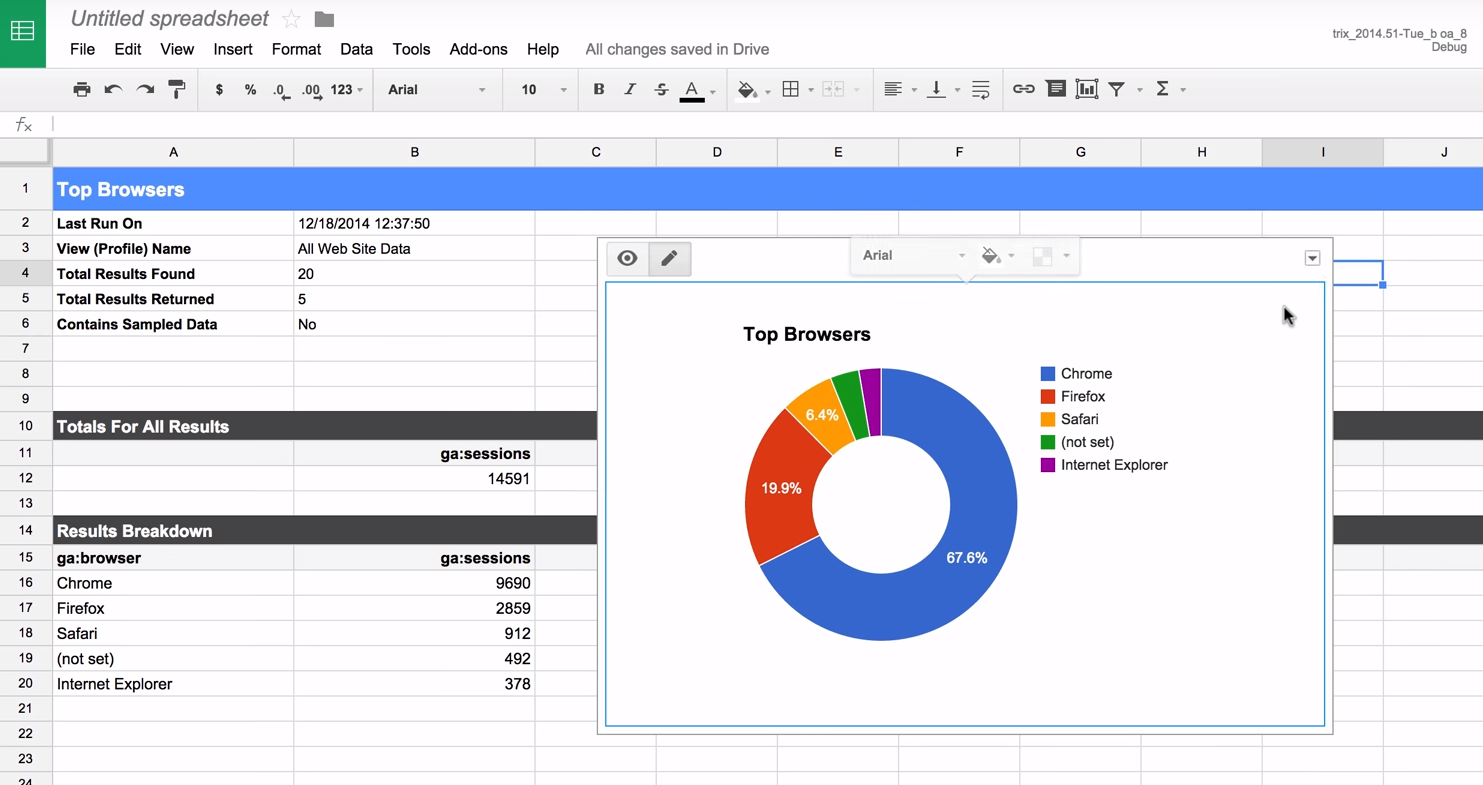
The add-on also makes it easy and quick to create your own analytical reports for free.
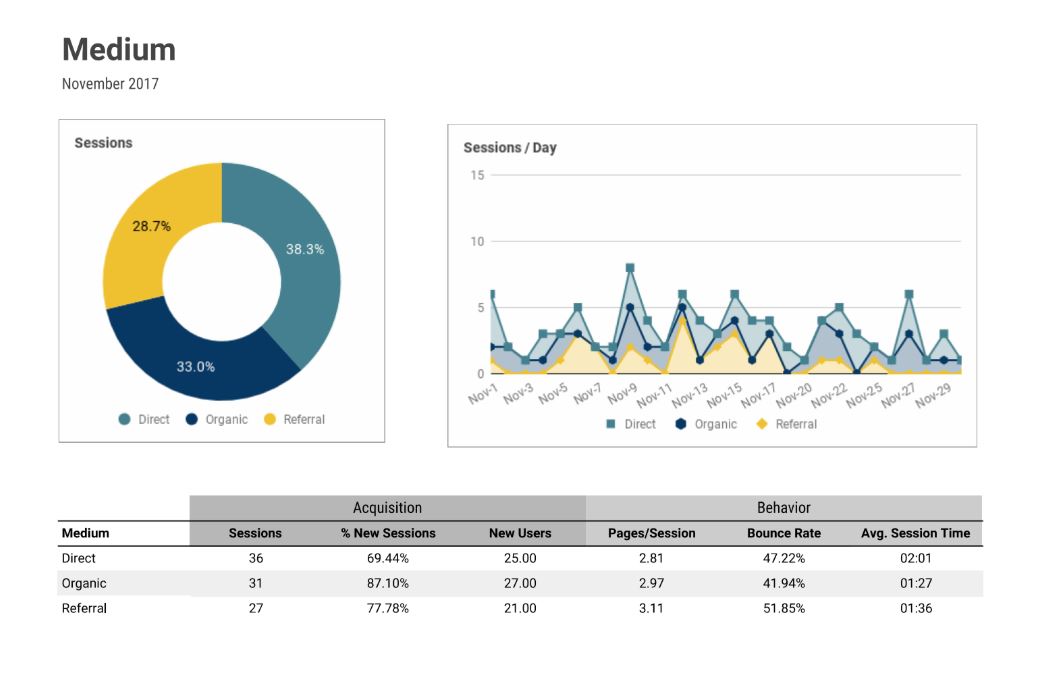
To use this tool effectively, you need to understand exactly what's what with the data. There's plenty of add-on documentation to help.
Don't get intimidated by some of the back-end scripts that some of the documentation shows—you don't need to dive in to any of that in order to use this tool effectively.
Once you get the hang of it, it's pretty easy to work with, and can help you get a much deeper understanding of your organic traffic.
Conclusion
As search engines continue to change and as advertisements continue to find creative ways to bombard us, keeping an eye on organic traffic is more important now than ever before.
With Google Analytics and supporting tools like SEOptimer and the Google Analytics add-on, you can go from organic traffic training wheels to badass motorbike rider in one fell swoop!
